How Speko Benchmarks TTS: A Gate, Then a Profile
No single number ranks a synthetic voice, so we don't publish one. We run a two-stage pipeline — first prove the speech is intelligible with Whisper-large-v3, then profile how it actually sounds: harmonics, micro-stability, and prosody. Here's the method, in waveforms and spectrograms.
Every TTS leaderboard wants to hand you one number. A MOS score, a star rating, a single “naturalness” percentage. One digit is easy to put on a landing page.
The problem is that one number hides the two failures that actually matter. A voice can sound buttery smooth and say the wrong words. Another can be perfectly accurate and sound like a 2009 GPS unit. A single score can’t tell those apart — which means it can’t tell you which voice to ship.
So we don’t publish one. Our TTS benchmark is a two-stage pipeline: a hard pass/fail gate on intelligibility, then a multi-axis acoustic profile for everything that clears it. The output isn’t a trophy. It’s a diagnostic — and it’s built on the raw signal, not a vibe.
Stage 1: the intelligibility gate
Before we measure quality, we measure correctness. The logic is non-negotiable: an acoustic score computed on speech that says the wrong thing is garbage with a decimal point.
Every utterance starts as a waveform — the literal pressure signal the model produced.
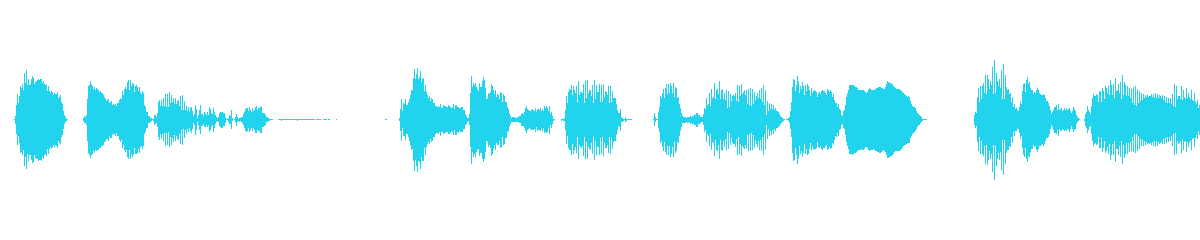
The gate is a round-trip. We synthesize a fixed prompt set, transcribe the audio back with Whisper-large-v3, and compute character error rate (CER) against the reference text. We also check the language Whisper detected. A provider clears the gate only if its CER is low and the audio is actually in the target language.
That second condition matters more than it sounds. In the languages vendors quietly fudge, we routinely catch models that don’t synthesize the requested language at all — they fall back to an English voice reading the foreign text phonetically. The audio is fluent, confident, and completely wrong. Whisper flags the language mismatch, the sample fails the gate, and it’s excluded from every downstream chart. We never let an English-fallback signal get scored against a non-English reference and call the noise a result.
Stage 2: profiling the sound
Only voices that clear the gate get profiled. And profiling happens where the truth lives — in the spectrum.
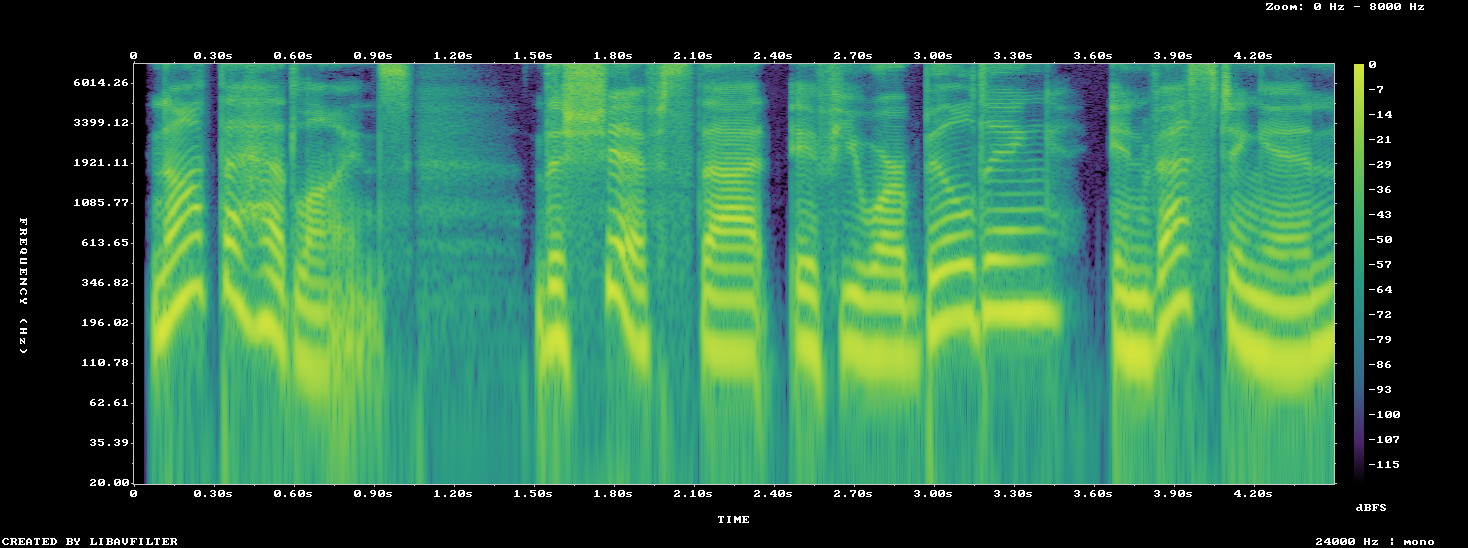
A spectrogram turns the waveform into something measurable: the dark horizontal bands are formants (the resonances that make vowels intelligible), the fine stacked lines are harmonics, and the texture between them is where artifacts and noise hide. Every axis of our acoustic profile is extracted from this representation.
Robotic, or natural? “It sounds robotic” usually means one of two opposite things: too much instability (buzzy, artifacted) or — more often with modern neural TTS — too little. Real vocal folds are never perfectly periodic. Strip out all the micro-variation and the result lands in the uncanny valley: clean, but lifeless.
We measure that with jitter (cycle-to-cycle pitch wobble), shimmer (amplitude wobble), and harmonics-to-noise ratio, extracted with a Praat pipeline. The trick is the reference. Clinical jitter/shimmer bands come from sustained vowels held in a lab and reject every real-world recording — including real humans reading the same script. So we recomputed the natural band from 50 utterances across 24 human audiobook speakers, measured with the identical pipeline. A voice that sits below the human band — lower jitter, lower shimmer, suspiciously high HNR — isn’t “better.” It’s too clean. That’s the synthetic tell: not noise, but the absence of the imperfection that makes a voice read as alive.
Prosody: is the pitch alive, or flat?
The axis listeners feel first, and name last, is prosody. A voice can clear the gate and sit inside the natural band and still sound dead — because its pitch barely moves. So we track the fundamental-frequency (F0) contour over the utterance and measure how much it actually varies.
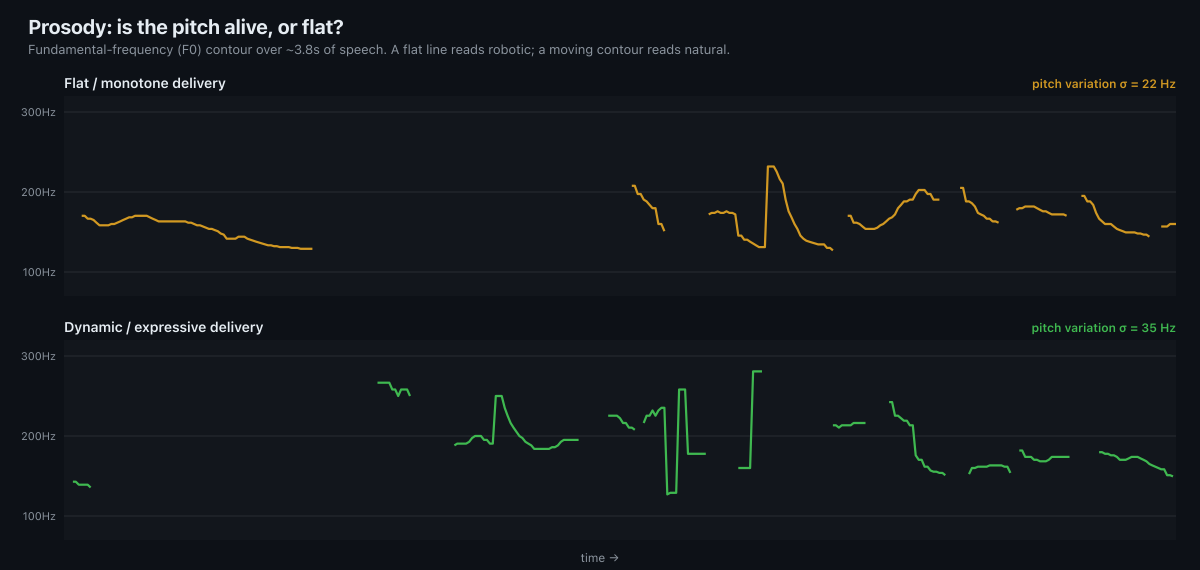
The contrast is the whole story. A flat, plateaued contour is the monotone that makes a voice feel like a kiosk. A contour that rises and falls across the sentence carries emphasis, intent, and emotion — the things that make synthetic speech feel human. The pitch-variation figure (σ) puts a number on it.
For tonal languages we go further, because there prosody is meaning, not just affect. We use %V — the proportion of each utterance that’s vocalic — which separates the syllable-timed rhythm of a tonal language from the stress-timed rhythm of English. We didn’t take that on faith: we correlated %V against native-speaker ratings and got ρ = +0.70. That earns it a place as a validated floor — below it, the rhythm reads as English wearing the language as a costume. Above it, the field is too tight for one metric to crown a winner, so we don’t pretend otherwise.
Why a profile beats a score
The honest part of this method is knowing the limits of each metric. %V is a floor, not a trophy. Some acoustic features correlate with human judgment in one language and invert in another — so where the math can’t decide, we say so and hand the verdict to a native listener rather than manufacture a number to fill the cell.
That’s the whole philosophy. One score tells you a voice is “8.4.” A profile tells you it’s intelligible, slightly too clean to feel alive, and a touch flat in its prosody — and shows you the waveform, the spectrum, and the pitch track that prove it. The first is a marketing asset. The second is something you can actually build a product on.
Figures are illustrative of the pipeline. Methodology and per-language analyzers live in the Speko benchmark repo; intelligibility uses Whisper-large-v3, acoustic features a Praat pipeline against a human baseline.